To check if the Data
Analysis is already installed in your Excel;
1. Click Data, in
the Ribbon.
2.
If you cannot see the Data Analysis command, click the Office Ribbon.
3.
Click the Excel Options in the lower part of the Office Button.
4.
A dialog box will appear as you can see in the picture.

5.
Click Go.
6.
A dialog box will appear. Check the Analysis ToolPak.
6.
Then, click again the Data Tab in the Ribbon.
7. A new command
will appear in the right most side of the tab, the Data Analysis.
Steps:
1.
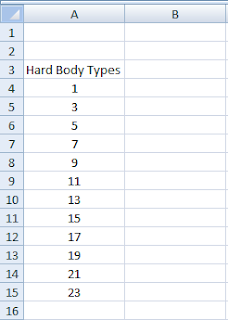
Enter the first sample data set in column A.
2. Enter the second
sample data set in column B.
3.
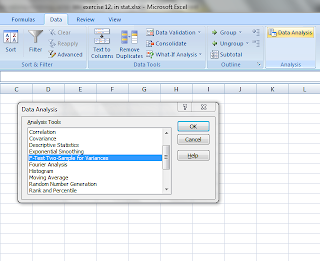
Select DATA Tab in the Ribbon, Data Analysis and choose F-Test: Two Samples for
Variances.
4. Enter the ranges
for the data in column A and B.
5. Specify the
confidence level, Alpha.
6. Specify a
location for output, and click OK.
7. After you have done these steps, you can see the result.
8. Analyze the result then make decisions and summary of the result.
I hope you understand these steps and learn how to use excel as tool for data analysis.
By: Tito Nuevacobita Jr.
III-Gold


No comments:
Post a Comment