Sunday, September 30, 2012
Correlation and Regression
Correlation- it is a statistical method used to determine whether a relationship between variables exist
Regression- it is a statistical method used to describe the nature of relationship between variables.
The technique of correlation and regression analysis determines whether there is an existing relationship between two or more numerical quantitative variables.
There are various step in correlation and regression analysis:
* Draw a scatter plot for the variables
Scatter Plot- is the graph of the ordered pairs of numbers consisting of the independent variables(found in the x-axis) and the dependent variable(found in the y-axis).
*Compute the value of the correlation of coefficient
In this step, you should first make a table consisting of 5 columns(x,y,xy,x-squared and y-squared)
you will also use this formula.
*State the hypothesis
In this step, you need to state the null hypothesis nand the alternative hypothesis.
*Test the significant of correlation coefficient
There are 3 possible methods to use. the t-test, the p-value, and the table If you will use the t-test or p-value, you need to undergo the hypothesi testing. While if you will use the table I, you just need to locate the alpha and the degree of freedom(n-2).
*Give a brief explanation of the type of relationship
For example,(t-test) you have obtain the value of t =4.059 and the C.V=2.776, you decision will be reject the null hypothesis and there is a positive linear relationship between the variables
*Find the equation of the regression line
You will solve for: y'=a+bx where
a= (summation of y)(summation of x-squared)-(summation of x)(summation of xy)
n(summation of x-squared )-(summation of x)quantity squared
b= n(summation of xy)-(summation of x)(summation of y)
n(summation of x-squared )-(summation of x)quantity squared
- if you have obtain the value of a and b, you can now give your prediction
by: Dustin Joshua Esquia III-Gold
Friday, September 28, 2012
What EVENT was in the 28th day of September 2012
On this day, we have no class in statistics because there was a program held in our school, but the work is not yet done. In the reason that we've work on our exercise about correlation and regression and passed it in this day.
BY: JOREY MARK MILLAMENA
SEPTEMBER 28,2012
BY: JOREY MARK MILLAMENA
SEPTEMBER 28,2012
September 25, 2012 – Continuation of our lesson about Correlation and Regression
September 25, 2012 – Continuation of our lesson about
Correlation and Regression
“We’ll be back to the process of hypothesis testing.”
-Ma’am Macatigos
Then, here we are again, back to the time wherein we are
testing hypotheses. I thought that the lesson on Correlation and Regression
will not include Hypothesis Testing anymore, but then again, it seemed like
hypothesis testing will all the way haunt us until the end of the second
grading.
Speaking of second grading, it is just about two to three
weeks until we will be getting our Second Departmental Test. This means that
after the time that we will get our test, we will be saying goodbye to Advanced
Statistics.
It seemed like it’s just yesterday that we’d entered the
room of Ma’am Kristin. We were so afraid at that time because it seemed like
ma’am was so very strict! During the first day I can still vividly remember
that I was sitting maybe at the third to the last row of the classroom, it was
my own choice to sit in there because I’m nervous. My nervousness rose a bit
when ma’am asked us what was our last lesson last school
year in advanced stat., in my mind I’m trying to think of something but to no
avail nothing came in. Thank God, I was not chosen to answer the question, and
after that It seemed like Ms. Macatigos asked us our grade in Math last year.
I’m happy ‘cause my grade in math last year was low, so I was not afraid of the
expectation that the teacher will have to me.
Weeks past and so many new thoughts were fed in our minds,
stuffs like probability that I hardly understand last year was renewed. I felt
like there is revitalization in me because I am thinking at that time that Stat
this school year will not be the same like the last school year.
Thank you Ma’am, your efforts in making the PowerPoint
slides helped us a lot, the nights you spent on making the handouts was not
wasted – it is the biggest help that we are able to understand a very hard
subject like STATISTICS!
Wednesday, September 26, 2012
Statistics Trivia's (PART II)
Now it's the second time of sharing ideas. Last time we've learned something new, and this time we will have better.
According to Statistics
If
you stack one million $1 dollar bills, the pile of money would weigh 2,040.8
pounds. If you used $100 dollar bills, the stack would weigh only 20.4 pounds.
With
382,650 babies being born each day and 144,902 people dying daily, the world
population increases about 237,748 people a day.
The
most popular hair removal among women is shaving. According to Gillette
Company, 70%of women who remove hair do so by shaving.
With
980-plus species, bats make up more than 23% of all known mammals by species.
The
most popular topic of public speakers is motivation at 23%, followed by
leadership at 17%.
Teenagers
often have episodes of anger and negatively in which they slam doors and scream
tirades. According to experts, most puberty-driven “snit fits” last an average
of 15 minutes.
Well, next time I hope that you could also teach me.
BY: JOREY MARK MILLAMENA
SEPTEMBER 26,2012
Sunday, September 23, 2012
September 11,2012-Lesson on Testing the difference Between Two Means (Small Samples) and Proportion (Sample Problem from the assignment)
1. A researcher found that 18 randomly selected
students from a private school has an average NSAT score of 84 with a standard
deviation of 16, while a random sample of 24 students from a public school
showed an average score of 80 with a standard deviation of 12. Is there any
evidence to show that the students from the private school performed better
than those from public school in NSAT examination using the 0.05 level?
To answer the problem we should first
conduct the F-test, to determine whether the variances are equal or not equal.
H0: σ12 = σ22
H1: σ12≠σ22
s1=16 s2=12 d.f.N=18-1=17 d.f.D=24-1=23 α=0.05÷2=0.025 CV=2.47
F= 162 ÷
122 = 1.78
Do not reject the Null Hypothesis.
If we will not reject the null hypothesis,
it means that the variances are equal.
After determining whether the variances are
equal or not, we will proceed to test the Difference of the mean.
Posted by: Kent Spencer Manalo Mendez
III-Gold
Friday, September 21, 2012
Testing the Difference between Two Proportions
In testing the difference between two proportions, we use the z-test to compare the two proportions. And in order to use the z-test, the samples must be independent to each other and n1p1 ≥ 30;n2p2 ≥ 30, n1q1
≥
30;n2q2 ≥ 30.
This is the Formula for the z-test for Comparing Two Proportions.
z=(p̂1-p̂2)-(p1-p2)/√(p-bar x q-bar x (1/n1+1/n2))
Let me give you an example
In a sample of 60 residents of Brgy. Mapurok, 9 had their own washing machine. In a sample of 70 resident of Brgy. Marupok, 24 had their ow2n washing machine. at a=0.05,can it be concluded that their is a significant difference in the proportion of the two Barangays which owns a washing machine?
Solution:
p̂1=9/60=0.15
p̂2=24/70=0.34
p-bar= 9+24/60+70=0.25
q-bar=1-0.25=0.75
Step 1: State the Hypothesis
Ho:p1=p2
H1:p1≠p2
Step 2: Find the Critical Value
a=0.05,two tailed test, C.V=± 1.96
Step 3: Find the Test Value
z= (p̂1-p̂2)-(p1-p2)/√(p-bar x q-bar x (1/n1+1/n2))
= (0.15-0.34)/ √(0.25)(0.75)(1/60+1/70)= -2.49
Step 4:Make the decision
Reject the null hypothesis
Step 5: Summarize the results
There is enough evidence to support the claim
By: Dustin Joshua A. Esquia III-Gold
Wednesday, September 19, 2012
Statistics Trivias (PART I)
Statistics can share us some of its trivia's because of its wide field, and now let me share to you some of these.
According to Statistics:
- The most common place name in Great Britain is newton, it occurs 150 times.
- Sweden is the biggest user of ketchup spending $4 a year on it. Australia comes in second with $2.50spent on ketchup each year. Third place goes to the United States and Canada who spend $2.20 a year on ketchup.
- More than 40% of the women in the United States were in the Girl Scout’s organization.
- If population continues to expand at its present rate, Calcutta, India, will have a population of 66 million in the year 2020.
- Tangshan, China, suffered the deadliest earthquake of the 20th century on July 28, 1976. One quarter of the population was killed or seriously injured, with an estimated 242,000 people killed.
- More than 45,000 pieces of plastic debris float on every square mile of ocean.
- If we were to up-turn the Millennium Dome at Greenwich, London, it would take 3.8 billion half-liters of bear to fill it up
- More than 50% of adults surveyed said that children should not be paid money for getting good grades in school.
I hope that you've learned something. Let's just continue this next time.
BY: JOREY MARK A. MILLAMENA
SEPTEMBER 20,2012
Statistics Description(PART II)
Advance Statistics can be describe by anyone and by any word, but for me as a student this would be the subjects really means.
Advance
statistics
A branch
of mathematics
With
problems which are systematic
To be
solve with many principles and tactics.
A subject
free for all
But to
others is not interesting at all
On the
topics place at the hall
With
the rating should not fall.
Means,
variances
Modes
and medians
Some
of ideas
That
this subject’s share to us.
BY: JOREY MARK A. MILLAMENA
SEPTEMBER 19,2012
Saturday, September 15, 2012
September 11, 2012 – Lesson on Testing the Difference between Two Means (Small Samples) and Proportion
It is Tuesday, and here we are again at the four corners of our classroom in Advanced Statistics discussing our new lesson. Our new lesson is not that new because we have already discussed hypothesis testing, yet for every lesson within this topic, there are some changes in the formulas and to what kind of test we will conduct, of what table are we going to use or what degree of freedom is recommended.
Testing the
Difference between two Means: Small Independent Samples
If the problem falls on small Independent
samples – we still need to conduct the F-test in order to determine the if the
variances of the populations are equal or not equal. If the variances are
unequal we will this formula for the t-test:
However, if the Variances are equal we
need to use this formula:
And the d.f.= n1+ n2-2
Testing the Difference
between two Means: Small Dependent Samples
Small dependent samples are used for problems that involve
Pretest and Post test administered to the same people.
µD, this symbol is for the expected mean of the differences
of the matched pairs.
Here are the possible Hypotheses for
Difference of two Means of Small Dependents Samples:
When we are finding the test value of Small Dependent
Samples, we are going to conduct a much longer process than that of the Small
Independent samples.
First thing to do is to find the
differences of the values of the pairs of data (x1-x2). Secondly
we will find the Mean of the differences by adding all the values and the
dividing the answer by the total population of the given data. Then find the
standard deviation of the differences. Next is to find the estimated standard
error of the differences. Last is to find the test value.
Posted By: Kent Spencer Manalo Mendez
III-Gold
Testing the Difference between two means(Small Samples)
In testing the difference between two means with small samples, you should first know if the samples are DEPENDENT or INDEPENDENT. If it is INDEPENDENT, you should first perform the F-Test in order to know if the variances are equal or unequal. While if it is DEPENDENT, there is another formula for it.
This is the formula for Small Independent Samples with Variances which are Unequal
This is the formula for Small Independent Samples with Variances which are Equal
where
This is the steps in finding the test value for Small DEPENDENT Samples
1. Find the Differences of the values of the pairs of the data
2. Find the mean of the differences by dividing the sum of the differences in step 1 by the number of samples.
3. Find the standard deviation of the differences
4. Find the estimated standard error of the differences by dividing the value that you obtain in the step 3 by the square root of n(number of samples)
5. Find the test value t= (D-μd)/(Sd /√n)
By: Dustin Joshua Esquia III-Gold
Thursday, September 13, 2012
A Tomorrows Challenging Statistics
In
every test and exams we take in our subject advance statistics there is no
assurance of always having a high score but for me there is always a way to
improve it. Just by having hope with me,
faith in God and trust to what I can do.
I was still feeling down
About my awful test score
But since yesterday’s lesson,
I learned stat wasn’t a bore
All those
means and variances
Are getting
quite fun.
{In the
sense that they are challenging and can be done by anyone}
Tomorrow
We have
another test
I think
I’ll do well
I know
I’ll try my best
Because
not only is stat fun
It is
enlightens everyone.
BY: JOREY MARK A. MILLAMENA
SEPTEMBER 13,2012
SEPTEMBER 13,2012
Editorial Statistics
Being a student I have pinions and suggestions on some
of our subjects. These opinions are just
our way of expressing and saying something on a certain specific subject. In this point I will share to you just a
little of my opinion with regards to our subject advance statistics.
Advance
statistics is not an easy subject but its difficulty is base on the one who
study it. Studying and understanding
more principles and ideas behind this subject makes an easy learning of
it. But inattentively listening and
participating to the discussing it makes the learning too difficult to
achieve. For me the learning of this
subject is just the same as other things, it only depends on the interest of an
individual.
End……..
BY:JOREY MARK MILLAMENA
Saturday, September 8, 2012
Steps in Using Microsoft Excel 2007 in Data Analysis for Z-test, Two Samples for Mean
To check if the Data
Analysis is already installed in your Excel;
1. Click Data, in
the Ribbon.
2.
If you cannot see the Data Analysis command, click the Office Ribbon.
3.
Click the Excel Options in the lower part of the Office Button.
4.
A dialog box will appear as you can see in the picture.
5.
Click Go.
6.
A dialog box will appear. Check the Analysis ToolPak.
6.
Then, click again the Data Tab in the Ribbon.
7. A new command
will appear in the right most side of the tab, the Data Analysis.
Steps:
1.
Enter the first sample data set in column A.
2. Enter the second
sample data set in column B.
3.
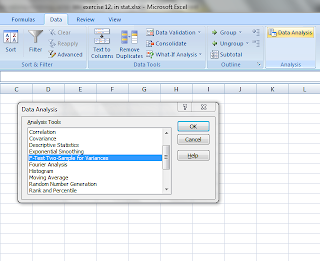
Select DATA Tab in the Ribbon, Data Analysis and choose F-Test: Two Samples for
Variances.
4. Enter the ranges
for the data in column A and B.
5. Specify the
confidence level, Alpha.
6. Specify a
location for output, and click OK.
7. After you have done these steps, you can see the result.
8. Analyze the result then make decisions and summary of the result.
I hope you understand these steps and learn how to use excel as tool for data analysis.
By: Tito Nuevacobita Jr.
III-Gold
Subscribe to:
Posts (Atom)