Sunday, October 28, 2012
Tuesday, October 23, 2012
Farewell Advanced Statistics!
Though it was a very good feeling that Stat was now done
with us, there is still that feeling of a little bit of loneliness that we will
miss this hard subject. We will miss the frequent use of calculators, which had
been our greatest friend in Advanced Statistics, the scientific calculator
which had been our help in every problem that we solved. We will also miss the
waiting for the photocopies of our handouts to be given by the leader of the
day, the times that we had to collect money/ pay money for the handouts, the
times that we had to text or call one of our classmates because we had no idea
of what are we going to do with an item that is included in the assignments and
exercises. And of course we will miss our Advanced Statistics teacher – Ms.
Kristin Macatigos, who will be married very soon.
Everything in this world has its beginning and its end. Like
Advanced Statistics, we will be bidding
goodbye to it, yet the lessons learned will be applied in some areas of our
everyday lives, and the memories formed during the time that we’re still on it
will be cherished!
Posted by: Kent Spencer Manalo Mendez
Friday, October 19, 2012
STATISTICS- All the Lessons for 2nd Grading
Second Grading is finally over. We had just finished the Departmental test last October 17-18, 2012. We find it very difficult especially in the subject STATISTICS. But luckily we had all finished it. We had taken the test for almost 2-hours. The test is a 50-item test. I find it very confusing in finding the critical value because it's hard to identify what kind of statistical test will be use.
Even though the different statistical methods have different formulas, they still use the Hypothesis TESTING(Stating the hypothesis, Finding the critical value, Solving for the test-value, Making the decision, Summarizing the result). For me, Hypothesis Testing is the most important to statisticians.
The Departmental Test include the following topics(all the topics for 2nd Grading):
* Z-test for Proportion
* Chi-square test for a Variance or Standard Deviation
* Testing the Difference between Two Means (Large Samples)
* Testing the Difference between Variances
* Testing the Difference between Two Means(small Samples)
* Testing the Difference between Proportion
* Correlation and Regression
* Test for Goodness of Fit
*Test Using Contingency Tables
* Analysis of Variance
Even though the different statistical methods have different formulas, they still use the Hypothesis TESTING(Stating the hypothesis, Finding the critical value, Solving for the test-value, Making the decision, Summarizing the result). For me, Hypothesis Testing is the most important to statisticians.
By: Dustin Joshua A. Esquia III-Gold
Wednesday, October 17, 2012
Tuesday, October 16, 2012

Testing the difference between two variances- Sept. 7, 2012
According to what I've learned...
Characteristics of F-distribution
-The values of F cannot be negative
-The distribution is positively skewed
-The mean value of F is approximately equal to 1
-The F distribution is a family of curves bases on the degrees of freedom of the variance of the numerator and the degree of freedom of the denominator.
Formula for F-test
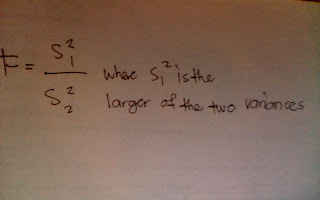
Use of F-test
1. The larger the variance should always be designated as variance sub 1 and be placed in the numerator formula.
2. For a two tailed test, the alpha must be divided and the critical value be placed on the right side of the f curve.
3. If the standard deviations instead of the variances are given in the problem, they must be squared for the formula for the F-test.
4. When the degrees of freedom cannot be found in table H. the closest value on the smaller side should be used.
Assumptions for testing difference between two variances
1. The populations from which the samples were obtained must be normally distributed.
2. The samples must be independent of each other.
That's all...
By: Carl Joel E. Palma III-Gold
Test for Goodness of fit- Sept. 12/ 2012
Chi square goodness of fit...
-used in testing to see whether a frequency distribution fits a specific pattern
- Hypotheses:
Ho: .... show no preference ....

-used in testing to see whether a frequency distribution fits a specific pattern
- Hypotheses:
Ho: .... show no preference ....
H1:
.... show preference....
- Degree of Freedom
n-1
-Formula for the Chi-Square Goodness of Fit Test

-Assumptions for Chi Square Goodness of Fit
1. The data that are obtained from a random sample.
2. The expected frequency for each category must be 5 or more.
-Procedure
1. State the null hypothesis and identify the claim.
2. Find the critical value.
3. Compute the test value. (sum of the values)
4. Make the decision.
5. Summarize the results.
-Procedure
1. State the null hypothesis and identify the claim.
2. Find the critical value.
3. Compute the test value. (sum of the values)
4. Make the decision.
5. Summarize the results.
Oh well, that's all that I can remember...
By: Carl Joel E. Palma III-Gold
Testing the Difference Between Two Means (Small Samples) and Proportion- Sept. 10, 2012
Testing the difference between two means: small independent samples
Formulas:

Testing the difference between two means: small independent samples
Formula:


Formulas:

Testing the difference between two means: small independent samples
Formula:

Testing the difference between proportions:

That's all...
By: Carl Joel E. Palma III-Gold
Correlation and Regression- Sept. 28, 2012
According to our teacher:
Terms...... In correlation and Regression
Correlation: Is a statistical method used to describe whether a relationship between variables exist.
Regression: A statistical method used to describe the nature of relationship between variables.
Scatter Plot: The graph of the ordered pairs (x,y) of numbers consisting of the independent variable x, and dependent variable y.
Correlation Coefficient: Use to determine the strength of the relationship between two variables.
Types of Relationships
1. Simple relationships- there are only two variables under study.
a. Positive relationship- exist when both variables increase or decrease at the same time.
b. Negative relationship- as one variable increases, the other variable decreases.
2. Multiple relationships- many variables are under study
Independent variable- is the variable in regression that can be controlled or manipulated
Dependent variable- is the variable in regression that cannot be controlled or manipulated
That's all...
By: Carl Joel E. Palma III- Gold
Test for Homogeneity of Proportions- Oct. 2, 2012
Test for Homogeneity of proportions
- it is used to determine whether the proportions for a variable are equal when several samples are selected from different populations
Hypotheses:
- it is used to determine whether the proportions for a variable are equal when several samples are selected from different populations
Hypotheses:
Ho: p1=p2=p3
H1: at least one proportion is different from the
others
Possible decisions:
Do not reject Ho, it can be assumed that the proportions are equal and the differences in them are due to chance.
Reject Ho, it can be assumed that the proportions are not equal.
By: Carl Joel E. Palma III- Gold
Contingency Tables- Oct. 1, 2012
Our lesson in Contingency tables:
This lesson is pretty hard though...
As what I've learned...
- Test for independence of variables is used to determine whether two variables are independent or related to each other when a sample is selected
First- State the hypotheses
ex.
Second- To get the degree freedom:
(R-1)(C-1)
ex.
If there are three rows and two columns
(3-1)(2-1)= 2
Third- Find the expected value
Fourth- Find the Test value
using this formula

Fifth- Find Critical Value
using d.f. = 2 a= o.o5 CV= 5. 991
Sixth- Make the decision.
Seventh- Make the summary.
By: Carl Joel E. Palma III- Gold
This lesson is pretty hard though...
As what I've learned...
- Test for independence of variables is used to determine whether two variables are independent or related to each other when a sample is selected
First- State the hypotheses
ex.
Ho: The opinion about the procedure is independent...
H1: The opinion about the procedure is dependent...
Second- To get the degree freedom:
(R-1)(C-1)
ex.
If there are three rows and two columns
(3-1)(2-1)= 2
Third- Find the expected value
Fourth- Find the Test value
using this formula

Fifth- Find Critical Value
using d.f. = 2 a= o.o5 CV= 5. 991
Sixth- Make the decision.
Seventh- Make the summary.
By: Carl Joel E. Palma III- Gold
Scheffe and Tukey Tests- Oct. 12, 2012
Scheffe Test
-Used when the decision is to reject the null hypothesis
-You need to compare the means two at a time using all possible
combinations
Formula:

Tukey Test
- According to our teacher, this test can be used after the ANOVA
has been completed to make pairwise comparisons between means when the
"groups have the same sample size.
Formula:

That's all...
By: Carl Joel E. Palma III- Gold
Monday, October 15, 2012
October 9,2012-Lesson about ANOVA (Analysis of Variance)
Next week
will be the schedule for our second departmental test, so we are now going fast
with our lessons so that we will be able to take the whole coverage of Advanced
Statistics.
Now we’re having
the lesson about Analysis of Variance (ANOVA). This lesson will be useful for
our Advanced Research next school year so we should understand the lesson well.
Here are some key points for this lesson:
*The z-test
and t-tests should not be used when three or more means are compared, instead,
F-test can be used to compare three or more means. (ANOVA)
*The most
commonly used tests are the Scheffe test and Tukey test.
*Between-Group
variance (SB2)– one of the first estimates, involves
finding the variance of means.
*Mean Square
of the Between Group (MSB) – one of the first estimates, made by
computing the variane using all the data and is not affected by differences in
the means.
*Within-Group
Variance (SW2) or Mean Square of the Within-Group (MSW)
– the second estimates, is made by computing the variance using all the data
and is not affected by differences in the means.
*Analysis of
variance used to compare three or more means which contains only one variable.
(One-Way Analysis of Variance)
*ANOVA that
involve two variables. (Two Way Analysis of Variance)
*No
difference in the means: the between group variance estimate will approximately
equal to the within group variance estimate; F test value will be approximately
equal to one; Null hypothesis will not be rejected.
*Means
differ significantly: the between-group variance will be much larger than the
within-group variance; F test value will be significantly greater than 1; the
Null hypothesis will be rejected.
*k=number of
groups
*N=sum of
the sample sizes for groups
*SSB
=sum of squares between groups
*SSw=sum
of squares within groups/ (sum of squares for the error)
*MSB
=Between group variance (SB2)=SSB/k-1)
*MSW =Error
variance
*Scheffe
Test = one must compare the means two at a time, using all possible combination
of means.
*Tukey Test
can also be used after the analysis has been completed to make pairwise
comparisons between means when the groups have the same sample size. The symbol
for the Tukey test is q.
Analysis of
Variance includes a wide range of symbols, ideas and needs a lot of
understanding. Our knowledge of ANOVA will be used for our studies when we are
already in 4th year.
Posted by: Kent Spencer Manalo Mendez
Chi-Square and Tests of Contingency Tables
CHI-SQUARE AND TESTS OF CONTINGENCY TABLES
Hypothesis tests may be performed on contingency tables in order to decide whether or not effects are present. Effects in a contingency table are defined as relationships between the row and column variables; that is, are the levels of the row variable deferentially distributed over levels of the column variables. Significance in this hypothesis test means that interpretation of the cell frequencies is warranted. Non-significance means that any differences in cell frequencies could be explained by chance.
Test for Independence
One of the most frequent uses of X2 is for testing the null hypothesis that two criteria of classification, when applied to a population of subjects (or objects), are independent. Two criteria of classification are said to be independent if the distribution of one criterion in no way depends on the distribution of the other. If the two criteria of classification are not independent, there is an association between them.
When data are arranged in table form for the chi-square independence test, the table is called a contingency table. The table is made up of R rows and C columns.
For the degree of freedom=(R-1)(C-1)
For the expected value=

Example:
Problem 1. A market research firm wishes to know whether they can conclude that, for adults in a certain city, the brand of car driven is associated with the drivers area of residence. A random sample of 500 adult drivers is interviewed to determine what brand of car they drive and in what area of residence they live. Test the claim at α=0.05.
The table shows the results:

Step 1.
Ho: The brand of car and the area of residence are independent of each other.
H1: The brand of car and the area of residence are dependent of each other. (claim)
Step 2.
C.V. =9.488
d.f= (R-1) (C-1) = (2) (2) = 4
Step 3.


χ2 = 19.82
Step 4.
Reject the null hypothesis.
There is enough evidence to support the claim.
__________________________________________________________________________________
The chi-square test of significance is useful as a tool to determine whether or not it is worth the researcher's effort to interpret a contingency table. A significant result of this test means that the cells of a contingency table should be interpreted. A non-significant test means that no effects were discovered and chance could explain the observed differences in the cells. In this case, an interpretation of the cell frequencies is not useful.
__________________________________________________________________________________
By Tito Nuevacobita Jr.
III-GOLD
Saturday, October 13, 2012
Simple Regression and Correlation Analysis
Statistician frequently must estimate how one variable is related to or affected by another variable. A firm may need to determine how its sales are related to the gross national product or it may need to determine how its total production costs are related to its output rate. To estimate such relationships are, they use correlation analysis.
One of the reasons for the importance of regression particularly in business and economics applications is that it can be used to forecast variables. Almost all companies and government institution frequently forecast variables such as product demand, interest rates, inflation rates, prices of raw materials and labor costs.
The technique involves developing a mathematical equation that analyzes the relationship between the variable to be forecast and the variables that the statistician believes are related to the forecast variable. The variable to be forecast variables. The variable to be forecast is called the dependent variable and is denoted by Y, while the related variables are called the independent variables are denoted by X.
Regression Analysis
Regression analysis describes the way in which one variable is related to another. Regression analysis derives an equation which can be used to estimate the unknown value of one variable on the basis of the known value of the other variable. For example, suppose that a hosiery mill is scheduled to produce four tons output next month and once to estimate how much it cost will be. In this case, although the mills output is known its cost are unknown.
Regression analysis can be used to estimate the value of the cost on the basis of the known value of output. Regression analysis can also be used to estimate the level of capital expenditures required to establish a plant with certain capacity. In the case of the hosiery mill, if the plant’s capacity were known regression analysis could be used to predict the firm’s level of expenditure.
Suppose that the firm collects such data for a sample of nine months, the results being shown in the table I below:
Output (tons) Production cost (thousands of dollars)
1 2
2 3
4 4
8 7
6 6
5 5
8 8
9 8
7 6
There are two ways in solving this problem. The first method provides a rough estimate. It uses the graphical approach and the second method which uses the regression formula, gives the exact value of Y when X is 12.

The first method employs the scatter diagram. In this diagram, the X known variable is the monthly output rate-is plotted along the horizontal axis and is called the independent variable. The unknown variable- the monthly cost is plotted along the vertical axis called the dependent variable.
After plotting the points corresponding to nine pairs of X and Y, the next step is to draw the trend line. This line represents the series of points that were plotted in such a way that the line approximates the general direction of the points and passes through the points.
Let us now estimate the value of Y when X is 12 by using the trend line. First we draw a vertical line cutting the trend line through a value of X=12. At the point where this vertical line and trend line intersect, we draw a horizontal line until it intersects or cuts through the Y axis. The point on the Y axis through which this horizontal line passes is our rough estimate of Y when X=12.

Note that this estimate of Y will vary slightly depending on how accurately the trend line was drawn. In our example, the estimate using the graphical methods is near 11.
The second method makes use of the equation of the Least Squares Regression Line or LSRL for short.
y =a + b x


Where:
y =dependent variable
x =independent variable
a =y-intercept
b =slope of the line

a=1.268
b=0.752
y= a+ bx
if x=12
y= 1.268 + 0.752(12)
y=10.92 the standard cost when the output is 12
Correlation
If two variables are related in such a way that the points of a scatter diagram tend to fall in the straight line, then we say that there is an association between the variables and that they are linearly correlated. The most common measure of the strength of the association between the variables id the Pearson correlation coefficient, denoted by r is given by the formula:

Problem:
A laboratory wishes to study the relationship between the dose of a growth stimulant and weight gain for laboratory animals. Seven animals of the same sex, age , and size are selected and randomly assigned to one of seven dosage levels of the growth stimulant.

Plot the data in the scatter diagram and calculate the correlation between the two variables.


Rounding Rule: Round the value of r to three decimal places.
Thus we have r=0.973 which is a very high correlation.
Interpretation of r:
The value of r will always be between -1 and +1. The closer it to either -1 or +1 the stronger the linear relationship between X and Y. If r=0, then X and Y are not linearly related.
These figure below illustrate 3 diagrams of data of various values of r. If r is positive, then there is positive linear relationship between the two variables, meaning that as one variable increases the other variable increases also. If r is negative, then there is a negative linear relationship, meaning that as one variable increases the other variable decreases.


According to Garrett’s interpretation of coefficient of correlation:
An r=0 denotes no correlation
An r from ± 0.01 to ±0.20 denotes indifferent or negligible relationship;
An r from ± 0.21 to ±0.40 denotes low correlation present but slight;
An r from ±0.41 to ±0.70 denotes substantial or marked relationship;
An r from ±0.71 to ±0.99 denotes high to very high correlation.
If r=±0 denotes perfect correlation
By: Tito Nuevacobita Jr.
III-GOLD
Friday, October 12, 2012
Statistics in poetry
I come into class
feeling real clever
for today's test
I'm as ready as ever.
As I pull out my paper
And ready my pen .
My teacher looks at me with confidence
Knowing I can
She writes on the board ,
The problems to solve
They look real easy
no trouble at all
Solving for mean and variance
And two columns of summation
I finish it all
And lat out a loud "phew"
I hand my paper
Which my teacher accept with smile
I leave the room happy
knowing it was all worthwhile.
BY: JOREY MARK A. MILLAMENA
OCTOBER 10,2012
ANOVA- October 11, 2012
This topic is our last one.
And even though it is easy it is also a time consuming work to do.
You need to;
1st. State the Hypothesis and identify the claim.
2nd. Find the Critical Value.
3rd. Compute the test value: get the mean and variance of each sample, find the grand mean.
4th. Find the between group variance and within group variance.
5th. Find F-test value.
6th. Make the decision.
7th. Summarize the result.
8th. Plot the summary table for ANOVA.
and also there are tests like Scheffe Test and Tukey test that you need to do if your decision is to reject the null hypothesis.
And scheffe tests will be long if you have many variables.
It is a great topic to learn because we can use it in our Research proposals.
By: Carl Joel E. Palma III- Gold
Analysis of Variance
Analysis of Variance
-used to compare three or more means which contains only one variable.
-used instead of t-test because all the means are compared simultaneously
With the F-test, two different estimates of the population variances are amde:L
1. Between-Group variance-involves finding the variance of the means
2. Within-Group variance-made by computing the variance using all thye data and is not affected by the difference of the means.
In the analysis of variance, you will perform the hypothesis also.
1. You will state the hypothesis
Ho:m1=m2=m3...m4
Hi: at least one mean is different from the others
2. Find the Critical Value
d.f.N= k-1, where k is the number of groups
d.f.D= N-k, where N is the sum of the sample size of the groups
3. Compute the test value
a. Find the mean and variance of each sample.
b. Find the grand mean(the mean of all sample) which is obtain by adding all the data and dividing it by the grand total
c.Find the between-group variance
d. Find the within-group variance
e. Find the F-test value which is obtain by dividing the between-group variance by the within group variance.
4. Make the decision
5. Summarize the result
Note: If the hypothesis is rejected or there is a significant difference, you can find where is the difference by performing the Scheffe or Tukey test.
Scheffe test
-one must compare the means two at a time, using all possible combination of means
Tukey test
-used only if the groups have the same sample size
Wednesday, October 10, 2012
A GUITAR OF STATISTICS
Statistics is not just a subject. The way I treat it is not ordinary. Just a few of my treatment is this:
This subject gives me a thrill
That seems always I feel
Every moment with this
Was not just an ease
With science it fizz
That you can't easily dismiss
Like any of the criminal case
It deserves a proper time and place.
Treatment deal with what you feel, it can be your opinion or something else.
BY: JOREY MARK A. MILLAMENA
OCTOBER 10,2012
Monday, October 8, 2012
Test Using Contingency Tables
Test for homogeneity of proportions
-is used to determine whether the proportions for variable are equal when several samples are selected from different populations.Example:
A researcher selected a sample of 180 senior citizens from different Brgy. and asked each senior citizen, " Do you avail the discount fee for being a senior citizen?" The data are shown in the table. At a=0.05, test the claim that the proportion of senior citizen who avail the discount fee is the same at all Brgy.
Brgy.1
|
Brgy.2
|
Brgy.3
|
Total
|
|
Yes
|
20(14.44)
|
10(14.44)
|
22(14.44)
|
52
|
No
|
30(27.22)
|
40(27.22)
|
28(27.22)
|
98
|
50
|
50
|
50
|
180
|
State the Hypothesis
*Ho: p1=p2=p3(claim)
Hi: at least one proportion is different from others
Find the Critical Value
*d.f=(r-1)(c-1)
d.f=(2-1)(3-1), C.V=5.991
Compute the Test Value.
*Summation of (Observed value-expected value)2 /expected value
=13.77
Note:(In order to solve the Expected value,you must multiply the total in row with the total in the column and divide it with the grand total.For example,E1,1=(50 x 52)/180. the steps will be repeated until it reaches the Expected value of the last column and last row)
Make the decision:
*Reject the null hypothesis since 13.77>5.991
Summarize the results
*There is enough evidence to reject the claim
by: Dustin Joshua Esquia III-Gold
Subscribe to:
Comments (Atom)